2024-25 Water Year Precipitation vs. the Average (Final version)
Here is a graphic showing the amount of precipitation that has fallen so far this water year, which started on Oct 1. The water year (Oct 1 – Sep 30) is used by hydrologists and meteorologists as it more accurately reflects the accumulation of precipitation during the winter for use during the growing season.
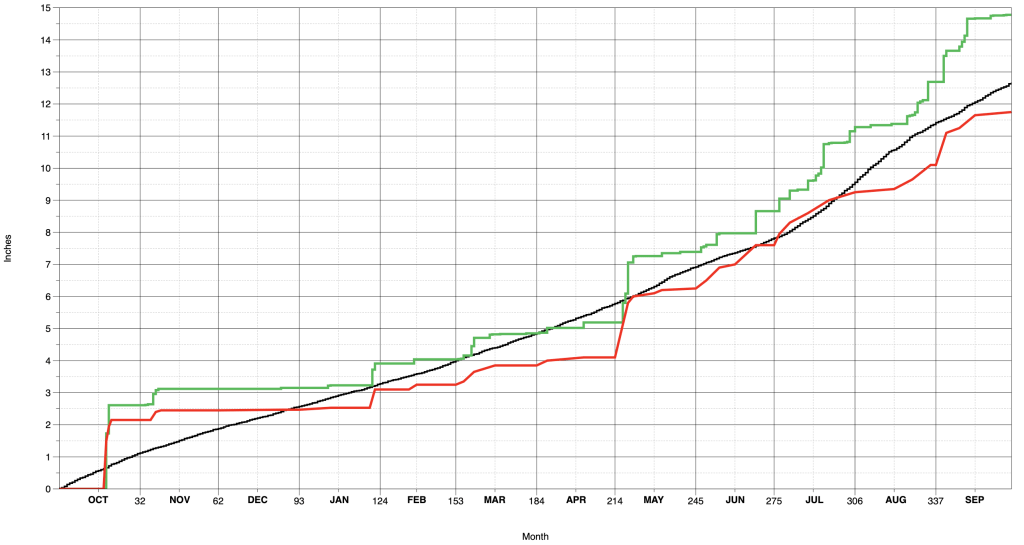
The current running total of precipitation here on the north side of Taos is shown by the green line below. The red line is the best guess estimated precipitation for the south side of Taos. The black line shows the average amount of precipitation based on 120 years of data. Inches of rain is the vertical axis, while the days and months of the year are on the horizontal axis.
Precipitation started off in the new water year way above average, thanks mainly to a widespread rainstorm in Oct. Some other storms occurred in Nov, Jan and Mar that brought much needed precipitation. However, the dry spells from mid Nov through late Jan, plus another one in Feb and again in Apr took their toll on the water year totals.
Luckily, a widespread rain and snow storm hit the region in early May, producing a pretty uniform 1 1/2 to 2 inches of precipitation across the valley. During the summer, some areas (like across the southern sections) saw fewer and weaker rain storms. Across parts of the northern valley, there were timely and sometime heavy rain storms clear into Sep.
Hence the southside of town (as shown by the estimated red trace from 1 NNE of Ranchos) ended up about 3/4 of an inch below average for the water year. On the northside, precipitation totals were about 1 to 2 inches above average (as shown by the actual green trace from 4 NNW Taos).
| 4 NNW Taos . . . . . 14.78 inches (actual) |
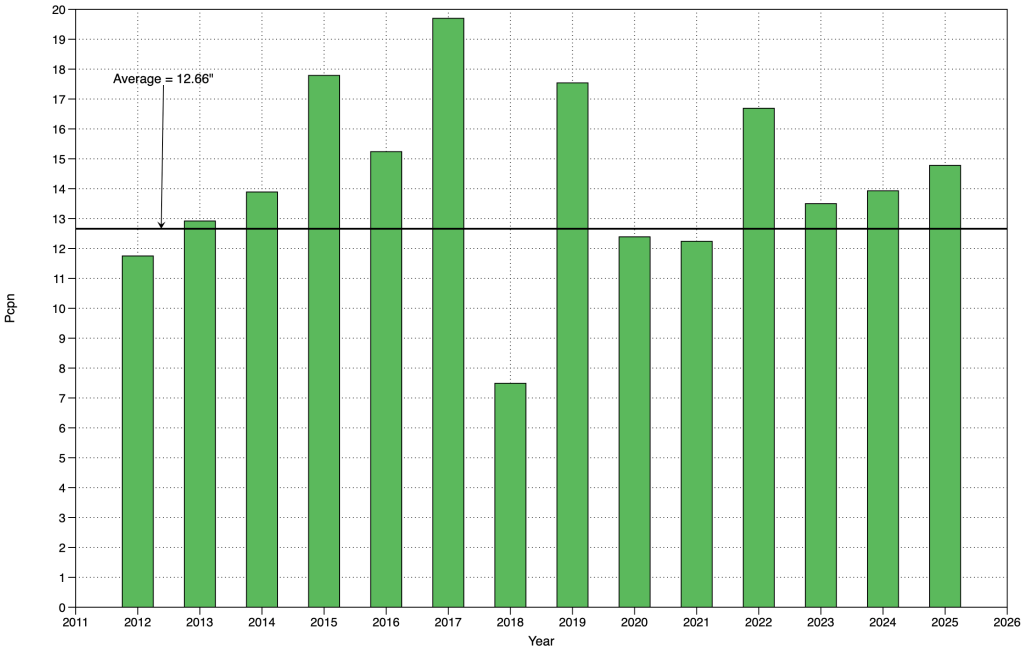
| Average total . . . . . 12.66 inches |
| 1 NNE Ranchos . . . 11.80 inches (estimated) |
Here are the water year totals since 2011-12 (2012 Year = 2011-12 Water Year)
—————————————————————————————————-
