September 2025 was just a bit warmer than average, with above average rainfall across most of the area. The average temperature was 60.3 degrees, about 0.7 degrees above average, mainly due to some slightly milder overnight lows.
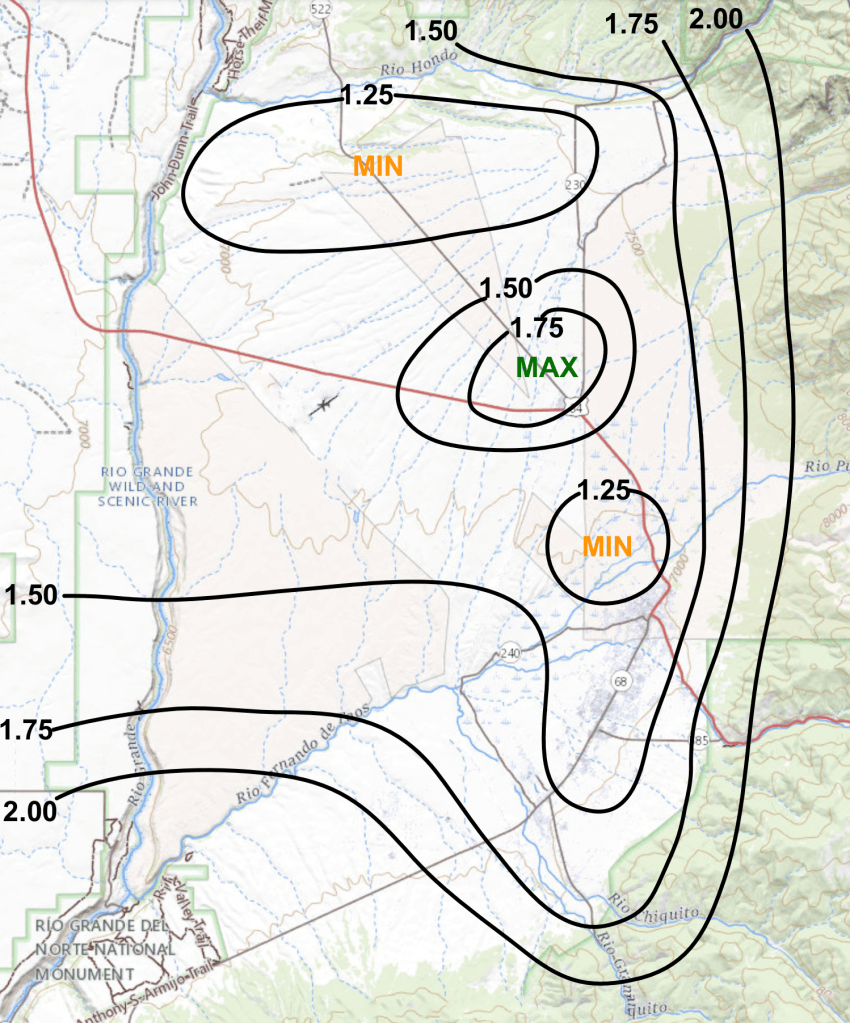
Precipitation totaled 2.09 inches at my northside location, with most areas recording above average rainfall across the valley. There were just a few spots where rainfall was near average (see rainfall map below). A couple of localized rain storms moved through the northern parts of the valley during the first part of the month, but completely missed the southern areas. The main widespread rain event occurred on the 10th to the 13th, with most areas receiving around an inch of rain during that time span.
The month started off warm and dry, but there were a few storms producing localized heavy rain on the 4th and 5th. After another warm and dry spell during the second week, a cooler and more moist airmass moved into the region from the 10th to the 13th, bringing a large proportion of the rain for the month. For the final 2 weeks of September, there would be only a few days with some spotty showers here and there, otherwise there was lots of sunshine with highs in the 70s and lows in the upper 30s and 40s.
The warmest high was 84 degrees on the 9th, while the coldest high was 64 degrees on the 13th. The coldest low was 34 degrees on the 24th, while the warmest low was 52 degrees on the 1st and 3rd. No records of temperature or rainfall were set during the month.
Overall, wind speeds for the month were a little below average, and there weren’t really any days that were windy all day. There were only 3 days with gusts of 35 mph or higher, with the highest gust of 48 mph occurring during a strong thunderstorm on the 4th.
Here are the actual numbers for the month at my 4 NNW Taos location…
Average Temp . . . . 60.3 degrees, +0.7 degrees above average
Average High . . . . . 76.2 degrees, +0.1 degrees above average
Average Low. . . . . . 44.3 degrees, +1.2 degrees above average
Total Rain . . . . . . . . 2.09 inches, +0.78 inches above average
SEP 2025 Rainfall Map (from observed rainfall amounts)
SEP 2025 DAILY DATA for 4 NNW Taos
| DATE | HIGH | LOW | DAILY DEP. | MON. DEP. | PCPN | REMARK |
| 1 | 81 | 52 | +2.6 | +2.6 | T | |
| 2 | 81 | 46 | -0.6 | +1.0 | ||
| 3 | 83 | 52 | +3.9 | +2.0 | T | |
| 4 | 81 | 50 | +2.1 | +2.0 | 0.81″ | 1/4″ hail 340 PM |
| 5 | 73 | 51 | -1.0 | +1.4 | 0.16″ | |
| 6 | 74 | 46 | -2.8 | +0.7 | ||
| 7 | 79 | 45 | -0.7 | +0.5 | ||
| 8 | 82 | 45 | +0.9 | +0.5 | ||
| 9 | 84 | 46 | +3.1 | +0.8 | ||
| 10 | 83 | 47 | +3.4 | +1.1 | 0.13″ | |
| 11 | 81 | 48 | +3.2 | +1.3 | 0.15″ | |
| 12 | 80 | 47 | +2.9 | +1.4 | 0.19″ | |
| 13 | 64 | 46 | -5.1 | +0.9 | 0.53″ | |
| 14 | 71 | 41 | -3.6 | +0.6 | ||
| 15 | 76 | 40 | -1.5 | +0.4 | ||
| 16 | 77 | 43 | +0.5 | +0.4 | 0.01″ | |
| 17 | 78 | 44 | +1.7 | +0.5 | ||
| 18 | 77 | 39 | -1.1 | +0.4 | ||
| 19 | 76 | 45 | +1.5 | +0.5 | ||
| 20 | 78 | 44 | +2.8 | +0.6 | ||
| 21 | 79 | 40 | +1.7 | +0.7 | ||
| 22 | 70 | 46 | +0.9 | +0.7 | 0.08″ | |
| 23 | 71 | 42 | -0.3 | +0.6 | 0.01″ | |
| 24 | 71 | 34 | -3.8 | +0.4 | ||
| 25 | 76 | 39 | +1.4 | +0.5 | ||
| 26 | 78 | 41 | +3.8 | +0.6 | ||
| 27 | 68 | 44 | +0.4 | +0.6 | 0.01″ | |
| 28 | 71 | 44 | +1.7 | +0.6 | 0.01″ | |
| 29 | 72 | 39 | -0.1 | +0.6 | ||
| 30 | 72 | 44 | +2.5 | +0.7 | T | |
| AVGS/ TOTAL | 76.2 | 44.3 | 60.3 | +0.7 | 2.09″ |
DAILY DEP. – Departure from the long term daily average temperature
MON. DEP. – Cumulative departure from the long term monthly average temperature
PCPN – Precipitation
T – Trace of precipitation
—————————————————————————————————-
