-
Weather Summary for October 2023
October 2023 was warmer and quite a bit drier than usual, as it ended up being the 8th driest October on record. The temperature was 2.6 degrees above average, while the rainfall was only 0.12″, nearly an inch below average.
All of the rain fell on the first 2 days of the month with some thunderstorms moving through the area. Across the valley, rainfall amounts for those 2 days varied from about 0.05″ to 0.15″. After that, there was no more measurable precipitation in the month, just some sprinkles on the 28th and then a few flurries on the night of the 29th/30th.
The month was notable for periods of warm sunny days, interrupted by a few days of cooler weather as cold fronts passed through on the 3rd, 12th, 24th, and 29th. The first 10 days of the month had highs in the upper 60s to mid 70s and lows in the 30s to mid 40s, with the first widespread frost on the 5th. Temperatures dipped the 12th to the 14th with highs down into upper 50s to mid 60s and lows in the mid 20s to near 30, with the first killing freeze of the season occurring on the 13th with a low of 23 degrees.
This was followed by a long stretch of warm and sunny weather from the 15th to the 23rd, with highs in the mid to upper 70s and lows in the 30s. It then cooled off a bit on the 24th to the 28th as highs dropped in the 60s with lows in the 30s. Finally, a strong cold front moved through the region on the 29th, bringing much colder temperatures for the end of the month as highs fell into the mid 40s to low 50s with lows in the teens to mid 20s.
The warmest high for the month occurred on the 20th with a high of 79 degrees, while the coldest high was 45 degrees on the 30th. The warmest low was 49 degrees on the 1st, while the coldest low was 12 degrees on the 31st.
Wind speeds overall were a little below average for the month, with just 6 days having gusts of 35 mph or higher. The day with the highest average wind speed was on the 12th, while the highest gust of 50 mph occurred on the 2nd with thunderstorms around.
Here are the actual numbers for the month…
Average Temp . . . . 51.1 degrees, +2.6 degrees above average
Average High . . . . . 68.5 degrees, +3.7 degrees above average
Average Low . . . . . 33.8 degrees, +1.5 degrees above average
Total rainfall . . . . . . 0.12 inches, -0.98 inches below average
Total snowfall . . . . . Trace on Oct 29/30
OCT 2023 Daily data
DATE HIGH LOW MON.
DEP.PCPN REMARK 1 75 49 +6.9 0.04″ 2 70 46 +5.0 0.08″ 3 64 38 +2.2 4 67 36 +1.2 5 72 32 +0.8 6 75 36 +1.1 7 71 36 +1.2 8 74 37 +1.5 9 74 36 +1.7 10 73 34 +1.8 11 71 36 +1.8 12 57 30 +1.1 13 61 23 +0.4 14 66 29 +0.3 15 71 29 +0.3 16 73 32 +0.5 17 77 35 +0.9 18 76 32 +1.2 19 77 32 +1.5 20 79 36 +2.0 21 78 34 +2.4 22 74 37 +2.7 23 73 38 +3.1 24 65 38 +3.2 25 67 38 +3.4 26 65 37 +3.5 27 65 34 +3.6 28 64 35 +3.7 Trace 29 52 29 +3.4 Trace Trace snow 30 45 21 +3.0 Trace Trace snow 31 51 12 +2.6 AVGS/
TOTAL68.5 33.8 51.1 0.12″ ——————————————————————
-
Weather Summary for August 2023
The heat from July lingered into much of the month of August, as it ended up as the 5th warmest on record, about 3.4 degrees above average. Enough rain fell during the month so that we ended up ‘only’ about a half inch below average.
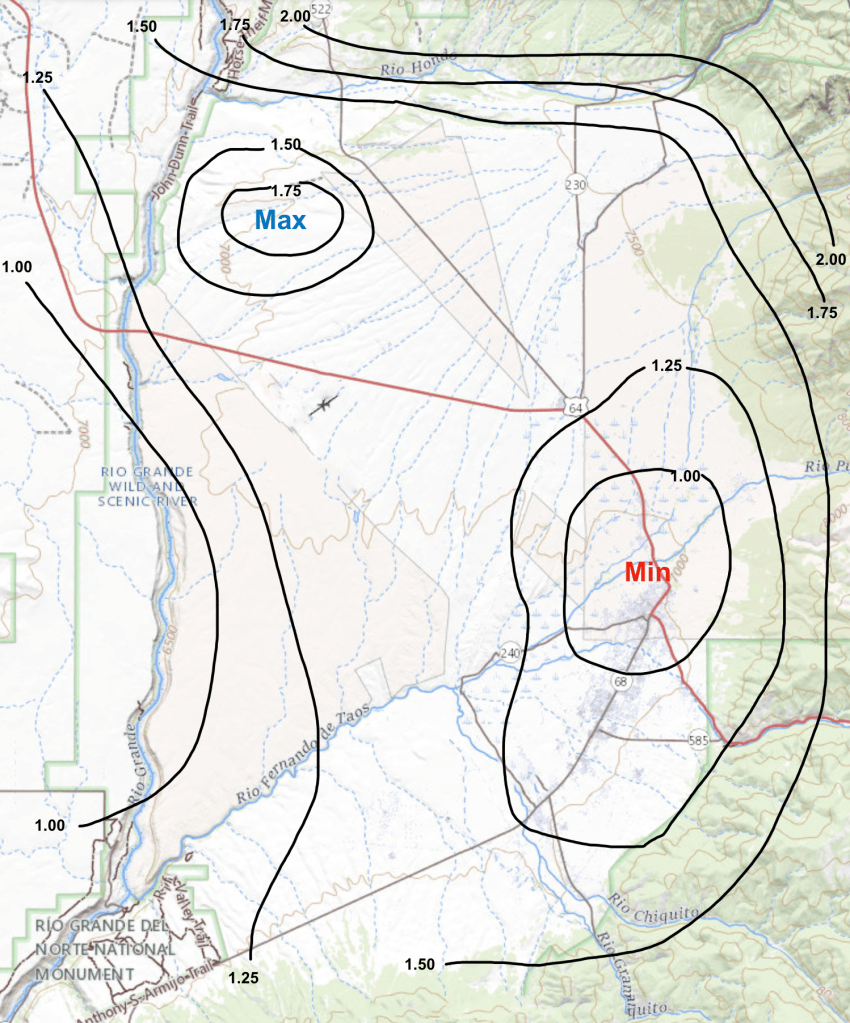
There were two main rainfall episodes lasting about 3 days each, one on Aug 12-14th, and another one on Aug 25-27th. The last one had a decent thunderstorm move right through most of the area on the 26th, bringing widespread rains of a half inch or more. Still, the northern part of the town of Taos missed out on the heaviest amounts, as rainfall for the month there totaled less than an inch (see map below). The Hondo Mesa had some of the highest amounts outside of the foothills.
The first 10 days of the month were the hottest with highs in the upper 80s to low 90s, with just a bit of rain falling on 2nd and 8th to cool things down briefly. During the two rainy periods mentioned above, highs dropped down into the mid 70s to low 80s. Otherwise highs were mainly in the mid to upper 80s during the month. There were 7 days in the month with highs of 90 degrees or more, with the hottest reading of 93 degrees occurring on the 5th and 6th. The coolest high was 73 degrees on the 14th.
As for lows, there were generally a little above average, especially from the 12th to the 28th as a moist airmass helped to keep readings up overnight. The warmest low was 63 degrees on the 22nd, while the coolest low was 48 degrees on the 17th and 29th.
Some records were broken or tied during the month. The reading of 93 degrees on the 6th tied the record warm high for the date. Daily record warm lows were tied or set on the 12th, 21st, 22nd, and 25th. And a daily rainfall record was set on the 26th with 0.63 inches falling on that day at my location.
Wind speeds overall were a little above average for the month, with 10 days having gusts of 35 mph or higher. The windiest days were on the 20th, 21st and 22nd. The highest gust of 52 mph occurred on the 31st around 645 PM from a stray weak thundershower.
Here are the actual numbers for the month…
Average Temp . . . . 69.7 degrees, +3.4 degrees above average (5th warmest)
Average High . . . . . 86.2 degrees, +3.8 degrees above average (9th warmest)
Average Low . . . . . 53.2 degrees, +3.0 degrees above average (5th warmest)
Total rainfall . . . . . . 1.34 inches, -0.53 inches below average
Total snowfall . . . . . . None
August 2023 Rainfall in the Taos area
AUG 2023
DATE HIGH LOW MON.
DEP.PCPN REMARK 1 86 55 +1.9 Trace 2 88 51 +1.6 0.06″ 3 89 52 +1.9 4 91 49 +2.0 5 93 51 +2.5 6 93 49 +2.7 Tied record warm high 7 89 54 +2.9 8 82 49 +2.3 0.06″ Pea size hail 1240 PM 9 87 49 +2.1 10 89 52 +2.3 11 90 53 +2.4 12 83 58 +2.6 0.08″ Tied record warm low 13 80 54 +2.4 0.13″ 14 73 57 +2.2 0.18″ 15 79 53 +2.0 16 88 52 +2.1 Trace 17 89 48 +2.1 Trace 18 90 52 +2.2 19 91 52 +2.4 20 89 55 +2.6 21 88 59 +2.8 Record warm low 22 88 63 +3.2 Record warm low 23 84 58 +3.3 Trace 24 93 55 +3.3 25 85 57 +3.4 0.14″ Record warm low 26 82 52 +3.4 0.63″ Record daily pcpn 27 81 55 +3.3 0.04″ 28 81 55 +3.3 Trace 29 83 48 +3.2 30 87 49 +3.3 31 90 52 +3.4 Trace AVGS/
TOTAL86.2 53.2 69.7 1.34″ 2022-23 Water Precipitation vs. the Average
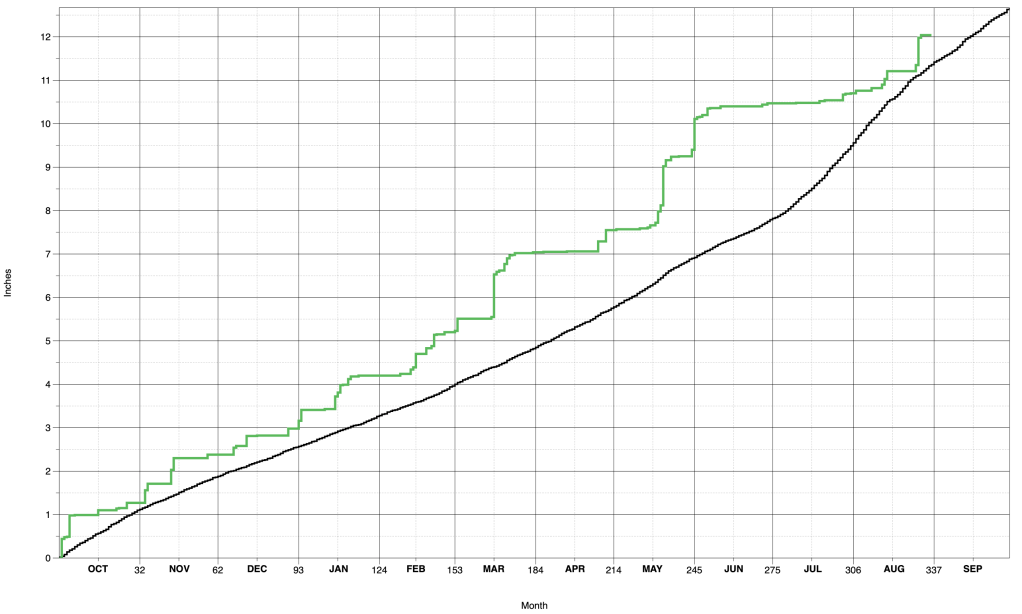
Here is a graphic showing the amount of precipitation that has fallen through the water year. The water year (Oct 1 – Sep 30) is used by hydrologists and meteorologists as it more accurately reflects the accumulation of precipitation for use during the growing season.
The current running total of precipitation here in Taos is shown by the green line below. The black line shows the average amount of precipitation based on 120 years of data. Inches of rain is the vertical axis, while the days and months of the year are on the horizontal axis.
For the 2022-23 water year, we have had above average precipitation for the entire water year (the green line) – by the second week of June we were up by over 3 inches. However, the dry spell since then almost got us caught up to the water year average (the black line), before we got some much needed rain the last week of Aug.
—————————————————————————–
-
Weather Summary for July 2023
July 2023 will go down in the record books as one of the hottest and driest Julys since records began here in Taos around 1900. The month ended up as the second hottest and the first driest on record, with several other temperature records tied or broken.
Rainfall was sparse during the month, especially in the town of Taos, where less than 0.10 of an inch of fell. At my location, 0.23 inches of rain fell, which was around an inch and a half below average. It was the driest July on record, with the previous driest July (0.30″) occurring back in 1938. Some spots received heavier amounts (west of Arroyo Seco and near the airport) but these were rather localized (see map below). Overall, the month was in stark contrast to last July when there was a lot of rain, the second wettest on record.
The heat was relentless during the month, in both the highs and the lows, with the month ending up as the second hottest July on record (1st hottest was in 2003). There were 26 days in the month with highs of 90 degrees or more, the most in any July since records began (previous record of 25 days in 2005). In addition, there was a span of 14 consecutive days with highs of 90 degrees or more (July 8-21), which is the fourth longest stretch (most in a row is 22 days in 2003).
Daily record warm highs were set or tied on the 15th, 17th, 18th, 24th and 26th. Daily record warm lows were set or tied on the 12th, 18th, 19th, 20th, and 27th of the month. The hottest high was 98 degrees on the 17th and 18th (just a degree below the all-time record high for Taos of 99 degrees set back on July 25, 2003). The coolest low was 45 degrees on the 1st.
Wind speeds overall were a little above average for the month, with 16 days with gusts of 35 mph or higher. The windiest days were on the 6th, 8th, and 21st. The highest gust of 53 mph occurred on the 2nd around 105 PM.
Here are the actual numbers for the month…
Average Temp . . . . 74.2 degrees, +6.2 degrees above average (2nd warmest)
Average High . . . . . 92.5 degrees, +7.8 degrees above average (2nd warmest)
Average Low . . . . . 55.8 degrees, +4.5 degrees above average (1st warmest)
Total rainfall . . . . . . 0.23 inches, -1.48 inches below average (1st driest)
Total snowfall . . . . . . None
July 2023 Rainfall in the Taos area

—————————————————————————–

Taos Weather

