-
Weather Summary for January 2026
January 2026 was warmer than average with above average precipitation. The average temperature was 29.0 degrees, about 3.6 degrees above average. This value was not exceptional, not like the warmth of November and December 2025. January 2026 was warm enough though to make the 3 months of Nov-Dec-Jan the warmest on record (second warmest was 2017-18, and third place was 1910-11).
Precipitation for the month was 1.02 inches at my northside location, nearly a third of an inch above average. Similar amounts from about 0.80 to 1.10 inches fell across the valley during the month. Almost all of the precipitation fell as snow, with a total of 12.3 inches for the month. By the end of January, almost all of the snow had melted.
The month started out very warm during the first week with highs in the upper 40s to mid 50s and lows in the 20s. A record daily warm high of 57 degrees was recorded on the 4th. A rather significant snowstorm, producing a record daily amount of precipitation and snowfall, occurred mainly on the 9th, with around 6 to 8 inches of snowfall plus much colder temperatures.
It gradually warmed up and remained dry through the middle two weeks of the month, as highs reached into the 40s with lows in the teens. Another storm system, weaker than the first one, hit the area on the 23rd and 24th, bringing about 2 to 3 inches of snow as highs fell into the upper 20s to low 30s. The last week was dry with a warming trend, as highs warmed into the 40s to near 50.
The warmest high was 57 degrees on the 4th, while the coldest high was 27 degrees on the 10th. The coldest low was minus 8 degrees on the 10th, while the warmest low was 27 degrees on the 1st.
Overall, wind speeds for the month were about average, with only 5 days having peak gusts over 25 mph. Strongest winds occurred on the 2nd and the 8th, with a peak gust of 32 mph on the 2nd.
Here are the actual numbers for the month at my location…
Average Temp . . . . 29.0 degrees, +3.6 degrees above average
Average High . . . . . 43.8 degrees, +3.8 degrees above average
Average Low. . . . . . 14.1 degrees, +3.2 degrees above average
Total Pcpn . . . . . . . . 1.02 inches, +0.31 inches above average
Total Snow . . . . . . . 12.3 inches, +4.1 inches above average
JAN 2026 DAILY DATA for 4 NNW Taos
DATE HIGH LOW DAILY
DEP.MON.
DEP.PCPN SNOW REMARK 1 48 27 +13.9 +13.9 2 49 25 +14.3 +14.1 T 3 55 19 +14.3 +14.1 4 57* 24 +17.5 +15.0 *Record warm high 5 49 22 +11.9 +14.4 6 48 18 +9.4 +13.6 7 51 18 +10.5 +13.1 0.04″ 0.4″ 8 41 27 +9.9 +12.7 0.05″ 0.7″ 9 31 6 -6.5 +10.6 0.68″* 8.4″* *Record pcpn & snow 10 27 -8 -15.8 +7.9 11 39 1 -5.2 +6.8 12 42 7 -0.2 +6.2 13 46 12 +4.5 +6.0 14 49 19 +8.8 +6.2 15 50 18 +8.7 +6.4 16 46 16 +5.0 +6.3 17 38 13 -0.7 +5.9 18 47 11 +3.0 +5.7 19 45 18 +5.0 +5.7 20 47 13 +3.7 +5.6 21 47 14 +5.2 +5.6 22 46 19 +7.8 +5.7 23 42 24 +7.8 +5.8 0.04″ 0.2″ 24 33 23 +2.0 +5.6 0.21″ 2.6″ 25 29 12 -6.6 +5.1 T T 26 33 -2 -12.1 +4.5 27 41 3 -5.7 +4.1 28 45 6 -2.0 +3.9 29 42 8 -2.4 +3.7 30 45 9 -0.9 +3.5 31 51 14 +4.1 +3.6 AVGS/
TOTAL43.8 14.1 29.0 +3.6 1.02″ 12.3″ DAILY DEP. – Departure from the long term daily average temperature
MON. DEP. – Cumulative departure from the long term monthly average temperature
PCPN – Precipitation
T – Trace of precipitation
—————————————————————————————————-
-
Weather Summary for Year 2025
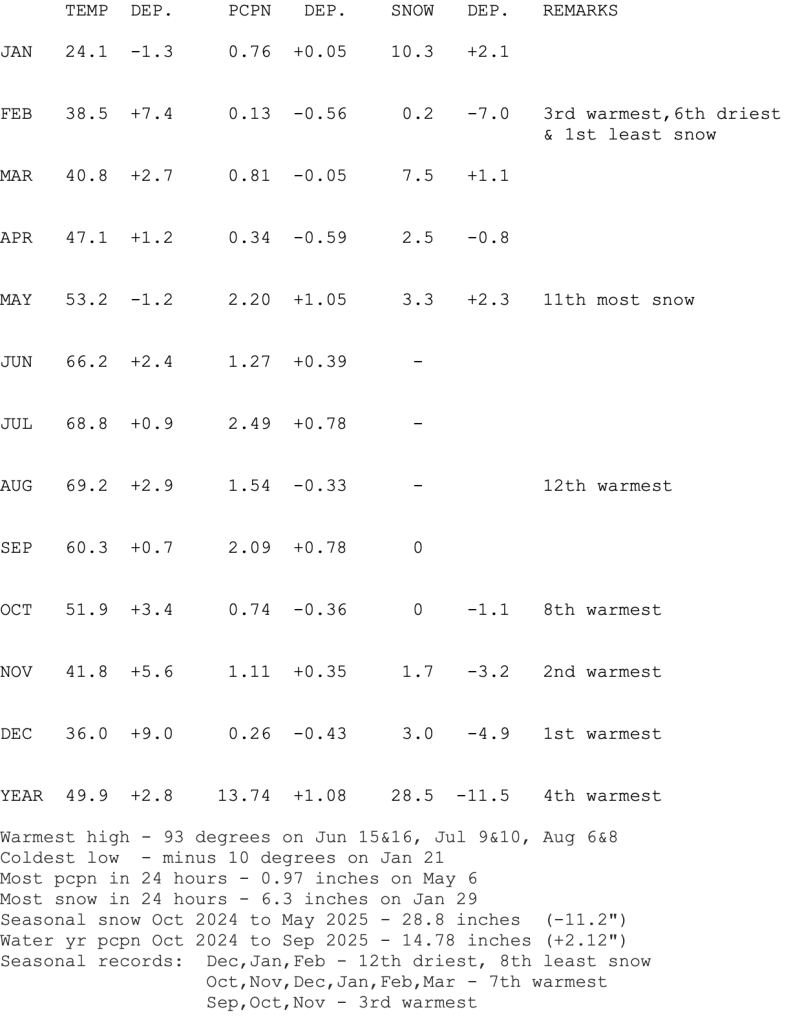
Weather-wise, the year 2025 in Taos was quite a bit warmer than usual, with a little above average precipitation overall. Only the months of January and May had temperatures below average, with every other month of the year above average. February was quite a bit above average (3rd warmest on record), with November (2nd warmest) and December (1st warmest) also averaging well above the usual readings.
For the year, the average temperature was 49.9 degrees, some 2.8 degrees above average, which was the 4th warmest on record (records began in the Taos area around 1900). Only the years 2003, 2017, and 2012 were warmer than 2025. Incidentally, last year (2024 with an average of 49.8 degrees), is now the 5th warmest on record.
The elevated temperatures throughout most of the year were due to both above average highs and lows. The months of February, August, November and December all recorded average high temperatures well above normal. The year’s average maximum temperature was the 3rd warmest on record. As for the average low temperatures, February, October, November and December experienced well above average readings, resulting in the average minimum temperature for the year ranking as the 9th warmest on record.
There were long periods of dry weather from January to May, with a few episodes of decent precipitation occurring from time to time. The biggest snow storm of the year occurred January 29th and 30th with 6 to 8 inches of snowfall. March 7th and 8th also had some decent precipitation, while the storm of May 4th through 6th brought nearly 2 inches of mostly rain and some snow to the area. Consequently, the total precipitation was about average by the start of summer.
The summer season from June to September ended up warmer than usual, but not record breaking. There were some hot spells from June 13th to 21st, July 8th to 11th, and in August from the 3rd to the 10th. Monsoon rainfall fell reliably throughout the summer, except for the first 3 weeks of August which were hot and dry. By the end of September, total precipitation for the year was about an inch and a half above average.
The autumn of 2025 was well above average in temperature, especially November and December. Precipitation-wise, October and December were both drier than average, with November a little wetter than usual. Precipitation for the year totaled 13.74 inches, which was just a little over an inch above average.
Snowfall for the year amounted to 28.5 inches, which was nearly 12 inches below average.
Below is the yearly summary by month, with temperatures (Temp) in degrees F, while precipitation (Pcpn) and Snow are in inches. Departures from the long term (1902-2019) average are shown in the Dep. column. Also included are the monthly/seasonal records set during the year, showing only those values that were ranked in the top 12 positions.
—————————————————————————–
-
Weather Summary for December 2025 – Warmest Dec on record
December 2025 was very much warmer than average, with precipitation below average. The average temperature was 36.0 degrees, about 9.0 degrees above average, making it the warmest December on record. (The previous warmest December occurred in 1980 with an average temperature of 35.4 degrees.) Both mild overnight lows but especially the warm daytime temperatures contributed to the above average readings.
In fact the average high for the month was 51.2 degrees, about 10 degrees above average. There were 19 days of highs over 50 degrees, and 15 of those days (half of the month!) had highs of 55 degrees or higher (beating the old record of 12 days above 55 set in 1939).
Record daily warm highs were set on 7 days during the month, with a stretch of 6 days in a row from the 19th to the 24th as highs were in the upper 50s to low 60s. The warmest high for the month of 63 degrees occurred on the 23rd, beating the old record by 6 degrees! (The warmest reading ever in December was 65 degrees which occurred on the 27th in 1980.)
The month was also on the dry side with only 0.26 inches of precipitation at my northside location, about a third of the monthly average. Similar amounts occurred in most areas in the valley, with a little more in the southern foothills though.
The first week of the month was cold and wet, with almost all of the precipitation occurring on the 3rd and 4th as highs were in the 30s to mid 40s. It then gradually warmed up the second week and continued abnormally warm through about the day after Christmas. Every single day from the 10th through the 26th had highs of 50 degrees or more.
It cooled down by Christmas weekend though with a bit of rain and snow, along with highs in the 40s and lows in the teens. Warm and dry conditions returned for the last 2 days of the month with highs back into the 50s.
The warmest high was 63 degrees on the 23rd, while the coldest high was 33 degrees on the 4th. The coldest low was just 10 degrees on the 5th, while the warmest low was 34 degrees on the 27th.
Overall, wind speeds for the month were about average, with a few days having peak gusts over 25 mph. Strongest winds occurred on the 3rd and 28th, with a peak gust of 30 mph on the 28th.
Here are the actual numbers for the month at my location…
Average Temp . . . . 36.0 degrees, +9.0 degrees above average (1st Warmest)
Average High . . . . . 51.2 degrees, +9.9 degrees above average (2nd Warmest)
Average Low. . . . . . 20.9 degrees, +8.2 degrees above average (3rd Warmest)
Total Pcpn . . . . . . . . 0.26 inches, -0.43 inches below average
Total Snow . . . . . . . 3.0 inches, -4.9 inches below average
DEC 2025 DAILY DATA for 4 NNW Taos
DATE HIGH LOW DAILY
DEP.MON.
DEP.PCPN SNOW REMARK 1 42 18 -0.9 -0.9 2 46 13 -1.7 -1.3 3 38 24 -0.2 -0.9 0.18″ 2.5″ 4 33 15 -6.2 -2.2 0.02″ 0.4″ 5 36 10 -6.3 -3.1 6 47 18 +3.3 -2.0 7 43 22 +3.5 -1.2 8 48 17 +3.7 -0.6 9 49 17 +5.2 0 10 51 22 +8.5 +0.9 11 59* 23 +12.7 +2.0 *Record warm high 12 60 21 +12.2 +2.8 13 57 20 +11.6 +3.5 14 56 18 +10.7 +4.0 15 53 18 +10.0 +4.4 16 57 16 +10.6 +4.8 17 56 20 +11.9 +5.2 18 53 28 +14.0 +5.7 19 58* 28 +17.0 +6.3 *Record warm high 20 57* 28 +16.0 +6.8 *Record warm high 21 58* 25 +15.7 +7.2 *Record warm high 22 62* 28 +19.5 +7.8 *Record warm high 23 63* 21 +16.2 +8.1 *Record warm high 24 61* 29 +20.2 +8.6 *Record warm high 25 55 31 +18.3 +9.0 26 52 27 +14.5 +9.2 27 46 34 +15.5 +9.5 0.05″ 28 41 19 +5.8 +9.3 0.01″ 0.1″ 29 43 12 +3.1 +9.1 30 50 11 +5.8 +9.0 31 56 14 +10.9 +9.0 AVGS/
TOTAL51.2 20.9 36.0 +9.0 0.26″ 3.0″ DAILY DEP. – Departure from the long term daily average temperature
MON. DEP. – Cumulative departure from the long term monthly average temperature
PCPN – Precipitation
T – Trace of precipitation
—————————————————————————————————-

Taos Weather

