-
Weather Summary for August 2025
August 2025 was quite a bit warmer than average, with rainfall below average across most of the valley. The average temperature was 69.2 degrees, about 3 degrees above average, making it the 12th warmest on record. It was mainly due to some persistently hot temperatures during the first 3 weeks of the month.
Precipitation totaled 1.54 inches at my northside location, about a third of an inch below average. Even less rain (below an inch) fell in the central and southern sections of the valley (see rainfall map below). A couple of localized rain storms moved through the northern parts of the valley during the month, but completely missed the southern areas.
The month started off cool and moist for the first couple of days, with highs of 80 to 85 and a bit of rain. It rapidly warmed up though starting on the 3rd, and the heat lasted through the first 3 weeks of the month, with highs in the mid 80s to low 90s and lows in the 50s. The warmest period of the month occurred from the 4th to the 9th with 6 consecutive days of highs of 90 degrees or more. Record warm highs were tied on the 6th and 8th as the mercury topped out at 93 degrees.
The hot and dry weather lasted clear through the 21st before a cooler and moister monsoon weather pattern set up during the last week of the month. Highs cooled into the upper 70s to mid 80s with some (but not a lot) much needed rainfall across the region.
The warmest high was 93 degrees on the 6th and 8th, while the coldest high was 75 degrees on the 27th. The coldest low was 47 degrees on the 25th, while the warmest low was 61 degrees on the 19th, which tied the record warm low for that date.
Overall wind speeds for the month were about average, and there weren’t really any days that were windy all day. However, most afternoons and evenings saw some gusty winds, as there were 9 days with gusts of 35 mph or higher, with the highest gust of 42 mph occurring on the 21st.
Here are the actual numbers for the month at my 4 NNW Taos location…
Average Temp . . . . 69.2 degrees, +2.9 degrees above average (12th warmest)
Average High . . . . . 86.1 degrees, +3.7 degrees above average (11th warmest)
Average Low. . . . . . 52.3 degrees, +2.2 degrees above average
Total Rain . . . . . . . . 1.54 inches, -0.33 inches below average
August 2025 Rainfall Map (from observed rainfall amounts)

AUG 2025 DAILY DATA for 4 NNW Taos
DATE HIGH LOW DAILY
DEP.MON.
DEP.PCPN REMARK 1 82 54 -0.1 -0.1 0.13″ 2 86 50 -0.2 -0.2 3 89 53 +3.0 +0.9 4 90 50 +2.3 +1.2 5 92 49 +3.0 +1.6 6 93* 50 +4.0 +2.0 0.06″ *Tied record warm high 7 92 52 +4.7 +2.4 8 93* 60 +9.3 +3.2 *Tied record warm high 9 92 52 +4.8 +3.4 10 87 52 +2.2 +3.3 11 86 49 +0.5 +3.0 12 83 55 +2.4 +3.0 13 88 52 +3.6 +3.0 14 91 57 +7.9 +3.4 15 86 55 +4.4 +3.5 0.04″ 16 85 53 +2.5 +3.4 17 88 47 +1.2 +3.3 18 91 54 +6.1 +3.4 T 19 87 61* +7.9 +3.7 T *Tied record warm low 20 87 51 +2.9 +3.6 21 87 53 +4.3 +3.7 0.24″ 22 90 51 +5.1 +3.7 0.02″ 23 82 57 +4.1 +3.7 0.02″ 24 79 50 -0.6 +3.6 0.08″ 25 84 47 +0.5 +3.4 0.30″ 26 79 56 +2.3 +3.4 0.04″ 27 75 56 +0.5 +3.3 0.04″ 28 83 49 +1.0 +3.2 29 80 52 +1.4 +3.1 0.57″ 30 80 47 -1.0 +3.0 31 81 48 +0.1 +2.9 T AVGS/
TOTAL86.1 52.3 69.2 +2.9 1.54″ DAILY DEP. – Departure from the long term daily average temperature
MON. DEP. – Cumulative departure from the long term monthly average temperature
PCPN – Precipitation
T – Trace of precipitation
—————————————————————————————————-
-
Weather Summary for July 2025
July 2025 was a bit warmer than average, with rainfall above average on the northside of the valley and below average on the southside. The average temperature was 68.9 degrees, about a degree above average, mainly due to some hot temperatures during the second week of the month.
Precipitation totaled 2.49 inches at my northside location, nearly 3/4 of an inch above average. A couple of localized rain storms moved through the northern parts of the valley during the month, but completely missed the southern areas. Most spots from the town of Taos south into the Ranchos area only received an inch of rain or less for the month. Highest amounts occurred along the northern foothills where amounts ranged from 2.50 to 3.00 inches.
The month started off cooler and moist for the first few days, with highs of 80 to 85 and light daily rain amounts. It gradually warmed up into the second week as highs rose into the mid to upper 80s. The warmest period of the month occurred from the 8th to the 16th as highs were mainly in the upper 80s to low 90s. However, as a moist monsoon pattern set up from the 17th to the 24th, temperatures cooled into the upper 70s to mid 80s. The last week of the month saw highs climb back into the mid 80s to near 90 with a few showers the last few days of the month.
The warmest high was 93 degrees on the 9th and 10th, while the coldest high was 76 degrees on the 24th. The coldest low was 47 degrees on the 2nd, while the warmest low was 59 degrees on the 12th.
Overall wind speeds for the month were a little below average, and there were only a few days that were windy, mainly on the 11th and 12th. Most afternoons saw some gusty winds however, as there were 10 days with gusts of 35 mph or higher, with the highest gust of 57 mph occurring during a thunderstorm on the 14th.
Here are the actual numbers for the month at my 4 NNW Taos location…
Average Temp . . . . 68.9 degrees, +0.9 degrees above average
Average High . . . . . 85.8 degrees, +1.1 degrees above average
Average Low. . . . . . 51.9 degrees, +0.6 degrees above average
Total Rain . . . . . . . . 2.49 inches, +0.78 inches above average
JULY 2025 Rainfall Map

JULY 2025 DAILY DATA for 4 NNW Taos
DATE HIGH LOW DAILY
DEP.MON.
DEP.PCPN REMARK 1 81 50 -1.7 -1.7 T 2 85 47 -1.4 -1.6 T 3 81 58 +2.2 -0.3 0.39″ 4 85 49 -0.5 -0.4 5 89 50 +2.1 +0.1 6 86 52 +1.1 +0.3 T 7 86 50 +0.3 +0.3 0.25″ 8 91 50 +2.4 +0.6 9 93 54 +5.9 +1.2 10 93 56 +6.0 +1.6 0.03″ Brief 1/4″ hail 215 PM 11 90 51 +2.0 +1.7 T 12 82 59 +2.0 +1.7 T 13 84 50 -1.3 +1.5 T 14 88 52 +1.8 +1.5 0.28″ 57 mph gust 237 PM 15 89 48 -0.1 +1.4 16 90 50 +1.3 +1.4 0.01″ 17 85 56 +2.1 +1.4 0.15″ 18 83 51 -1.3 +1.3 0.06″ 19 86 56 +2.6 +1.3 0.19″ 20 88 50 +0.7 +1.3 0.73″ 21 85 53 +0.7 +1.3 T 22 82 55 +0.8 +1.3 0.03″ 23 80 54 -0.9 +1.2 0.01″ 24 76 51 -4.2 +0.9 25 84 48 -1.8 +0.8 26 87 52 +1.6 +0.9 27 91 49 +2.5 +0.9 28 88 54 +3.5 +1.0 0.01″ 29 83 52 -0.7 +1.0 0.02″ 30 85 52 +0.3 +0.9 0.33″ 31 84 52 0 +0.9 T AVGS/
TOTAL85.8 51.9 68.9 +0.9 2.49″ DAILY DEP. – Departure from the long term daily average temperature
MON. DEP. – Cumulative departure from the long term monthly average temperature
PCPN – Precipitation
T – Trace of precipitation
—————————————————————————————————-
-
Weather Summary for June 2025
June 2025 was warmer and wetter than average. The average temperature was 66.2 degrees, about 2.4 degrees above average, mainly due to some hot temperatures during 10 days in the middle of the month.
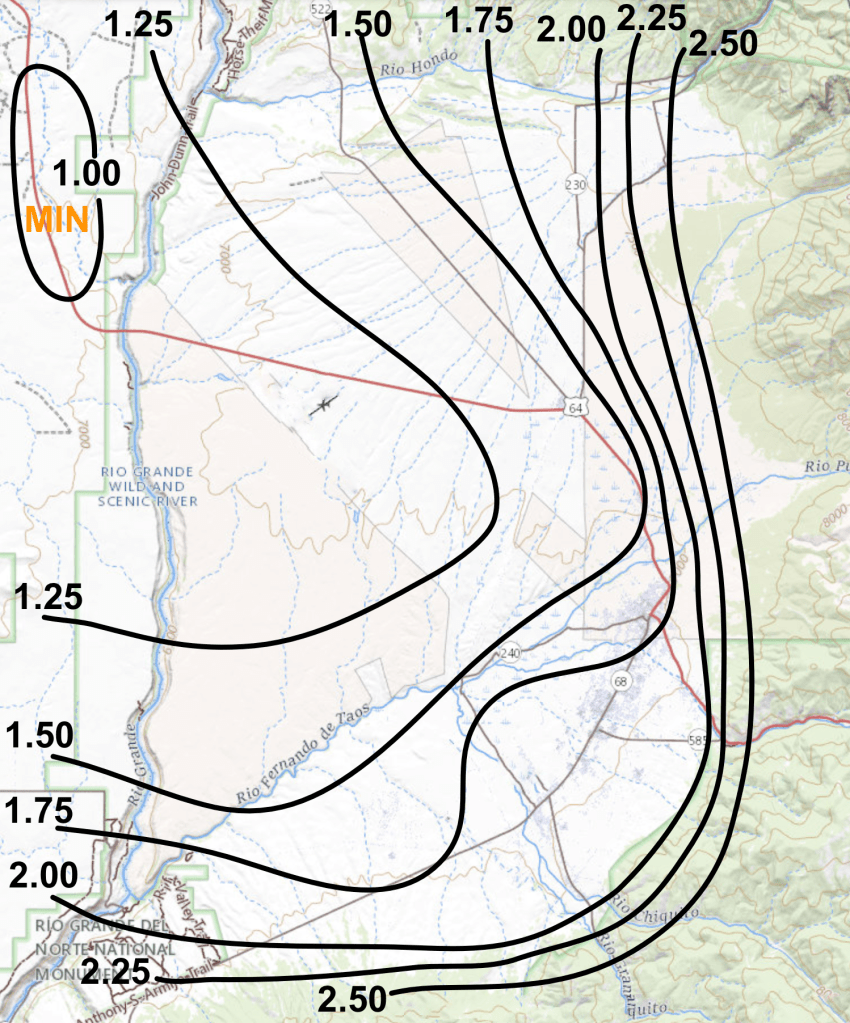
Precipitation totaled 1.27 inches at my northside location, a little more than a third of an inch above average. Most areas in the valley recorded more rain however, with areas around Taos and Ranchos de Taos receiving 1.50 to 1.80 inches of rain (see map below). Highest amounts occurred along the eastern and southern foothills where amounts ranged from 2.00 to 2.75 inches. A widespread rain event on the 24th brought nearly half of the monthly total to most areas.
The month started off cool and wet for the first few days, with highs in the upper 60s and 70s with some light rain amounts each day. It quickly warmed up through the second week however, as highs rose into the 80s.
The main weather event of the month occurred from the 13th through the 23rd as dry and hot weather moved into the region. Highs topped out in the upper 80s to low 90s during the period, with lows in the mid 40s to upper 50s. After a brief cool spell with the rain event of the 24th, temperatures rose again during the last week.
The warmest high was 93 degrees on the 15th and 16th, both record high readings for those days. The coldest high was 68 degrees on the 4th. The coldest low was 40 degrees on the 7th, while the warmest low was 59 degrees on the 17th.
Overall wind speeds for the month were a little below average, and there were only a few days that were windy – the 17th, 22nd and 23rd. Most afternoons saw some gusty winds however, as there were 11 days with gusts of 35 mph or higher, with the highest gust of 48 mph occurring on the 15th.
Here are the actual numbers for the month at the 4 NNW Taos location…
Average Temp . . . . 66.2 degrees, +2.4 degrees above average
Average High . . . . . 84.2 degrees, +2.6 degrees above average
Average Low. . . . . . 48.2 degrees, +2.3 degrees above average
Total Pcpn. . . . . . . . 1.27 inches, +0.39 inches above average
June 2025 Rainfall Map
JUN 2025 DAILY DATA for 4 NNW Taos
DATE HIGH LOW DAILY
DEP.MON.
DEP.PCPN REMARK 1 87 48 +8.7 +8.7 T 2 71 50 +1.1 +4.9 0.14″ 3 76 48 +2.2 +4.0 0.03″ 4 68 45 -4.0 +2.0 0.05″ 5 74 44 -1.5 +1.3 T 6 80 42 -0.5 +1.0 7 83 40 +0.2 +0.9 8 86 43 +3.0 +1.2 9 80 46 +1.3 +1.2 0.33″ 1/4″ hail 250 PM 10 81 43 0 +1.1 0.03″ 11 84 41 0 +1.0 T 12 84 44 +1.2 +1.0 T 13 88 44 +3.0 +1.1 14 91 47 +5.4 +1.4 15 93* 43 +4.2 +1.6 *Record warm high 16 93* 52 +8.5 +2.0 *Record warm high 17 88 59 +9.0 +2.5 18 88 45 +1.7 +2.4 19 91 51 +6.0 +2.6 20 91 57 +8.5 +2.9 T 21 90 54 +6.1 +3.0 22 86 52 +3.3 +3.1 23 87 48 +1.5 +3.0 24 81 54 +0.7 +2.9 0.69″ 25 78 52 -1.4 +2.7 26 83 49 -0.7 +2.6 T 27 84 52 +1.0 +2.5 28 89 49 +1.3 +2.5 29 89 50 +2.0 +2.5 30 81 55 +0.8 +2.4 T AVGS/
TOTAL84.2 48.2 66.2 +2.4 1.27″ DAILY DEP. – Departure from the long term daily average temperature
MON. DEP. – Cumulative departure from the long term monthly average temperature
PCPN – Precipitation
T – Trace of precipitation
—————————————————————————————————-

Taos Weather

