2025-26 Water Year Precipitation vs. the Average (Final update)
Here is a graphic showing the amount of precipitation that has fallen so far this water year, which started on Oct 1. The water year (Oct 1 – Sep 30) is used by hydrologists and meteorologists as it more accurately reflects the accumulation of precipitation during the winter for use during the growing season.
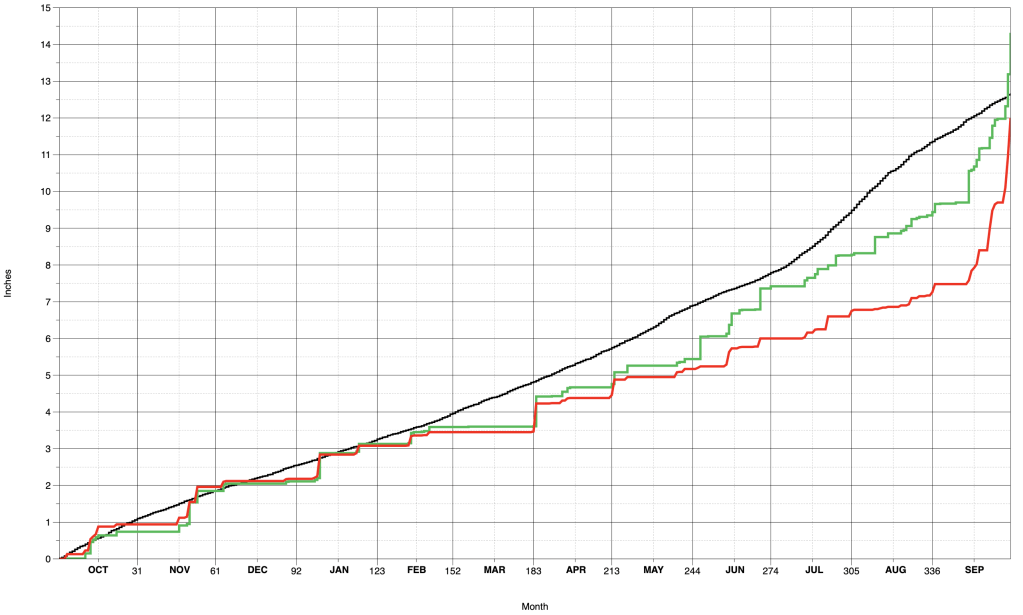
The current running total of precipitation here on the north side of Taos is shown by the green line below. The red line is the best guess estimated precipitation for the south side of Taos. The black line shows the average amount of precipitation based on 120 years of data. Inches of rain is the vertical axis, while the days and months of the year are on the horizontal axis.
Precipitation started off in the new water year a little below average during Oct, with a little more rainfall on the southside than at my northside location. In Nov, after a dry first half of the month, there was enough precipitation in the last 2 weeks to keep the totals right around average.
December though ended up on the dry side, with totals around a third of inch below average at the start of the new year. However, two storms during January brought a decent amount of precipitation to the area, so that water year totals are right around average at the start of February.
Drier than average conditions occurred in February, and it was very dry in March with almost no precipitation. Luckily, some much needed rain fell during the first 2 weeks of April, and also around the first part of May. However, the rest of May was pretty dry.
Some localized showers occurred during June, with widespread below average rainfall in July that has continued into August. By the end of the month, precipitation totals were 1.92 inches below average in the north (83% of average), but about 4.10 inches below average in the south (64% of average).
Then came the miracle of the September rains, with 4 to 6 inches of rain falling across most of the area. By October 1, water year precipitation totaled 14.32 inches on the northside, about 113% of the average (12.67″). Even the southside which had been way below average entering September, ended up with a total around 12 inches, or about 95 % of average.
—————————————————————————————————-

