August 2026 continued the trend of July 2026 by being quite a bit warmer than average, along with below average rainfall. The monthly average temperature was 72.4 degrees (a bit warmer than July!), which was about 6 degrees above average, making it the warmest August on record. Daytime high temperatures and nighttime low readings were both equally above average, especially in the first 2 weeks of the month.
A total of 8 record highs were set or tied during the period from August 2nd to the 12th, including a new record high for August of 96 degrees, recorded on the 5th and 6th (the previous monthly record was 95 degrees). Just one record warm low reading was tied during the month (on the 10th), although several overnight lows during the month came within a degree or two of the daily warm low records.
The string of days from the 2nd to the 12th all had highs of 90 degrees or higher, with the 11 days of consecutive 90+ degree highs ending up as the 7th longest streak on record. A total of 14 days during the month had 90+ degree highs, which was the 3rd most for August.
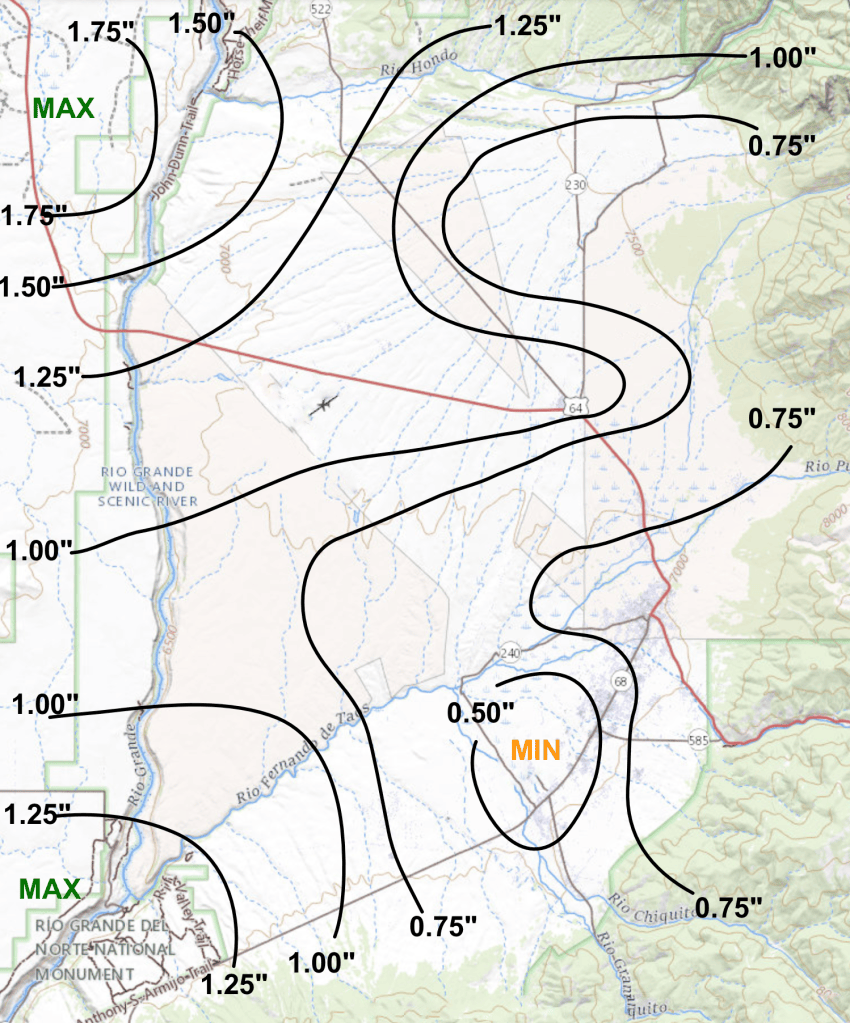
Rainfall during the month once again was below average across the valley. At my northside location rainfall totaled 1.16 inches for the month, about 3/4 of an inch below average (usual August rainfall is 1.87″). Parts of the northern and western sections got lucky with some localized storms during the month, but some southern spots around Ranchos missed out on most of the storms and ended up with totals only around a half inch or so (see rainfall map below).
Most of the rain fell in the last half of the month, except for a few localized storms on the 9th. Daily amounts of rain tended to be skimpy, generally less than a tenth of an inch. There were not really any days with heavy rains in the valley itself, although areas along and west of the gorge did have some decent rains on a few days.
The warmest high was 96 degrees on the 5th and 6th (a new record warm high for August), while the coolest high was 80 degrees on the 31st. The coolest low was 48 degrees on the 27th, while the warmest low was 60 degrees on the 5th.
Overall, wind speeds for the month were about average, with 12 days recording peak wind gusts of 35 mph or higher. Strongest overall winds occurred on the 4th to the 6th, while the highest gust of 52 mph occurred during a thunderstorm on the 9th.
Here are the actual numbers for the month at my location…
Average Temp . . . . 72.4 degrees, +6.1 degrees above average (1st warmest)
Average High . . . . . 89.4 degrees, +7.1 degrees above average (1st warmest)
Average Low. . . . . . 54.8 degrees, +4.6 degrees above average (1st warmest)
Total Rain . . . . . . . . 1.16 inches, -0.71 inches below average
AUG 2026 rainfall totals (from rain gauges)
AUG 2026 DAILY DATA for 4 NNW Taos
| DATE | HIGH | LOW | DAILY DEP. | MON. DEP. | RAIN | REMARK |
| 1 | 88 | 55 | +3.4 | +3.4 | 0.04″ | |
| 2 | 93 | 53 | +4.8 | +4.1 | ||
| 3 | 95* | 58 | +8.5 | +5.6 | *Record warm high | |
| 4 | 95* | 58 | +8.8 | +6.4 | *Record warm high | |
| 5 | 96* | 60 | +10.5 | +7.2 | *Record warm high for Aug | |
| 6 | 96* | 57 | +9.0 | +7.5 | T | *Record warm high for Aug |
| 7 | 91 | 59 | +7.7 | +7.5 | ||
| 8 | 94* | 53 | +6.3 | +7.4 | *Record warm high | |
| 9 | 93* | 56 | +7.3 | +7.4 | 0.44″ | *Tied record warm high & 1/4″ inch hail 329-338 PM |
| 10 | 94* | 58* | +8.7 | +7.5 | *Tied record warm low and high | |
| 11 | 94* | 55 | +7.5 | +7.5 | T | *Record warm high |
| 12 | 91 | 56 | +6.9 | +7.4 | T | |
| 13 | 86 | 57 | +5.1 | +7.3 | ||
| 14 | 86 | 58 | +5.9 | +7.2 | 0.10″ | |
| 15 | 87 | 59 | +6.9 | +7.2 | ||
| 16 | 89 | 52 | +4.0 | +7.0 | ||
| 17 | 88 | 51 | +3.2 | +6.7 | ||
| 18 | 91 | 53 | +5.6 | +6.7 | ||
| 19 | 93 | 56 | +8.4 | +6.8 | 0.07″ | |
| 20 | 89 | 52 | +4.4 | +6.6 | 0.02″ | |
| 21 | 92 | 55 | +7.8 | +6.7 | 0.11″ | |
| 22 | 89 | 52 | +5.1 | +6.6 | T | |
| 23 | 85 | 54 | +4.1 | +6.5 | 0.19″ | |
| 24 | 87 | 51 | +3.9 | +6.4 | ||
| 25 | 89 | 54 | +6.5 | +6.4 | 0.03″ | |
| 26 | 87 | 54 | +5.3 | +6.4 | 0.03″ | |
| 27 | 89 | 48 | +3.5 | +6.3 | T | |
| 28 | 88 | 52 | +5.0 | +6.2 | ||
| 29 | 89 | 54 | +6.9 | +6.2 | 0.04″ | |
| 30 | 84 | 55 | +5.2 | +6.2 | T | |
| 31 | 80 | 53 | +2.1 | +6.1 | 0.09″ | |
| AVGS/ TOTAL | 89.4 | 54.8 | 72.4 | +6.1 | 1.16″ |
DAILY DEP. – Departure from the long term daily average temperature
MON. DEP. – Cumulative departure from the long term monthly average temperature
T – Trace of rain
—————————————————————————————————-

