The summer of 2026 ended up being the warmest on record here in the Taos valley, with the previous warmest summer occurring in 2011. The month of August was especially hot, as it was even warmer than July.
A lot of the warmth came from the high temperatures during the summer, especially in August. There was one daily record high set or tied in June, one in July, and 8 daily records in August, including a new record high for the month of 96 degrees on the 5th and 6th. The summer average high of 88.4 degrees was the second warmest, just behind the summer of 2011.
As for the lows during the summer, they were consistently about 3 to 4 degrees above average. There were no daily record warm lows set or tied in June, 3 records in July, and 1 in August. The summer average low of 52.9 degrees was the third warmest on record, just behind the summers of 2006 and 2022.
Here is breakdown of the monthly and summer temperatures for 2026…
| June 2026 | July 2026 | August 2026 | Summer 2026 | |
| Average T | 67.8 degs | 72.0 degs | 72.4 degs | 70.7 degs |
| Departure | +4.0 degs | +4.0 degs | +6.1 degs | +4.7 degs |
| Rank | 8th Warmest | 4th Warmest | 1st Warmest | 1st Warmest |
| Average High | 86.2 degs | 89.5 degs | 89.4 degs | 88.4 degs |
| Departure | +4.6 degs | +4.8 degs | +7.1 degs | +5.5 degs |
| Rank | 10th Warnest | 6th Warmest | 1st Warmest | 2nd Warmest |
| Average Low | 49.4 degs | 54.6 degs | 54.8 degs | 52.9 degs |
| Departure | +3.5 degs | +3.3 degs | +4.6 degs | +3.8 degs |
| Rank | 11th Warmest | 5th Warmest | 1st Warmest | 3rd Warmest |
| Rainfall | 1.98″ | 0.86″ | 1.16″ | 4.00″ |
| Departure | +1.10″ | -0.85″ | -0.71″ | -0.45″ |
Not only was it quite warm during the summer, it was also dry as rainfall was less than usual, especially across the central and southern parts of the valley. Total summer rainfall at my north side location ended up at 4.00 inches, about a half inch below average (summer average rainfall is 4.45″), while a location on the south side totaled only 2.09 inches, about 2.36 inches below average. It was just a summer where a couple of lucky storms each month brought some higher amounts of rain to the northern sections, while the central and southern areas missed out on the heavier rains.
Why was it so hot and dry this summer? As it frequently does, it comes down to the strength, location and orientation of the upper level high pressure area that usually forms during the summer across the southwest U.S. This summer, the upper level high was stronger than usual, resulting in warmer temperatures. Its persistent location over the Four Corners region, and its orientation of west/northwest to east/southeast into Texas kept a lot of the monsoon moisture away from northern New Mexico (see figure 1 below).
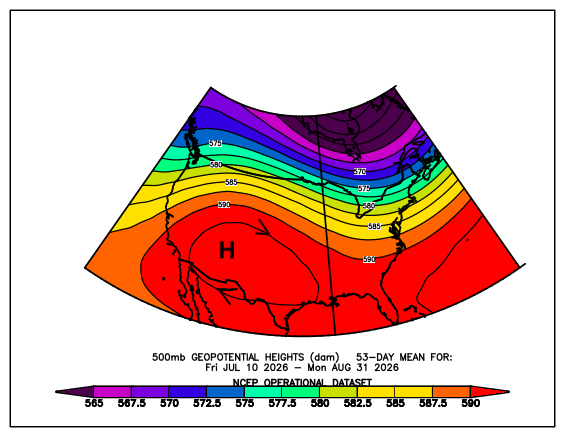
Figure 1 – Average airflow at about 18,000 feet above sea level for July 10 to August 31 2026. Note the location and strength of the upper level high pressure area over the Four Corners region, and the orientation of the high pressure area along a west/northwest to east/southeast axis. Airflow around the high (as shown by the arrows) took most of the monsoon moisture from northern Mexico further west into Arizona and then north into Utah/Colorado, missing most of northern New Mexico.
—————————————————————————————————-

