2026-27 Water Year Precipitation vs. the Average (Early Nov update)
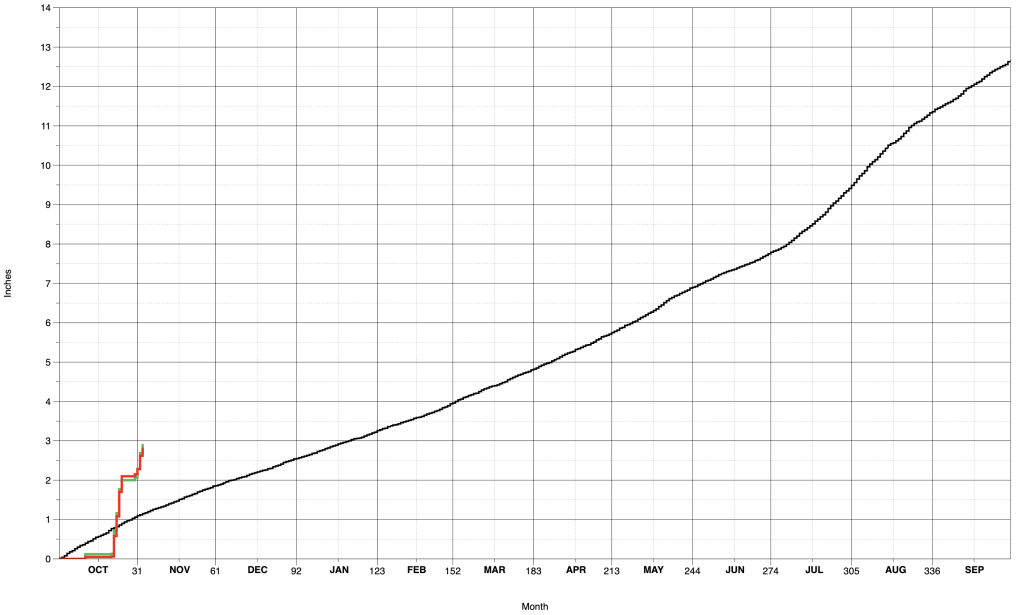
Here is a graphic showing the amount of precipitation that has fallen so far this water year, which started on Oct 1. The water year (Oct 1 – Sep 30) is used by hydrologists and meteorologists as it more accurately reflects the accumulation of precipitation during the winter for use during the growing season.
The current running total of precipitation here on the north side of Taos is shown by the green line below. The red line is the best guess estimated precipitation for the south side of Taos. The black line shows the average amount of precipitation based on 120 years of data. Inches of rain is the vertical axis, while the days and months of the year are on the horizontal axis.
October started off fairly dry until the third week of the month when a 4 day period of rain produced nearly 2 inches of rain. Some more rain fell on the last few days of the month, with the responsible weather system producing more rain the first few days of November. Total rainfall so far this water year is nearly 3 inches, way above the average amount of 1.15 inches.
Interesting tidbit – from September 28th through November 2nd (just 5 weeks), about 5.25 inches of rain has fallen in the area – which is about 42 percent of the annual total (12.66″)!
—————————————————————————————————-

