-
Weather Summary for September 2024
September 2024 overall was warmer and a little wetter than average. The average temperature was 61.4 degrees, about 1.8 degrees above average. Rainfall for the month across the valley was average to a little above average.
Areas along the northern foothills had the most rain in the region, about 1.60 to over 2.00 inches. Once again, the area around the towns of Taos and Ranchos de Taos received the least rain of around 1.20 inches, which was just a tad below average. The rest of the valley recorded rainfall of 1.30 to 1.60 inches, which was a bit above average (see map below). At my northside location, rainfall totaled 1.54 inches, about a quarter of an inch above average.
The month started out dry with above average temperatures through the first 4 days, with highs in the low to mid 80s. Things cooled off from the 5th to the 11th with some afternoon showers and highs in the mid 70s to low 80s. After a brief warmup from the 12th to the 15th with highs of 80 to 85, the main weather event of the month occurred on the 16th and 17th as widespread rain fell on both days (totaling nearly an inch) with highs dropping into the 60s to low 70s. Things stayed rather cool during the third week of the month, as highs were in the upper 60s to mid 70s, along with a few showers. A big warmup with dry conditions occurred during the last week as highs climbed into the upper 70s to mid 80s, and lows stayed above average in the mid 40s to low 50s.
Thunderstorms on the 17th and 21st were quite strong in some spots, producing heavy rain and some small hail, along with gusts of 40 to 50 mph.
Highs during the month were about 2.3 degrees above average, with lows coming in at about 1.2 degrees above average. The warmest high for the month was 87 degrees on the 3rd and 4th. The coldest high was 61 degrees on the 16th as it rained all day. The warmest low was 54 degrees on the 28th, a record warm low for that date, and the coldest low of the month was 39 degrees on the 24th.
Winds for the month were about average, with about 8 days with brief gusts over 35 mph. The highest gust of 53 mph occurred on the 17th in a thunderstorm.
Here are the actual numbers for the month at the 4 NNW Taos location…
Average Temp . . . . 61.4 degrees, +1.8 degrees above average
Average High . . . . . 78.4 degrees, +2.3 degrees above average
Average Low . . . . . 44.3 degrees, +1.2 degrees above average
Total rain. . . . . . . . . 1.54 inches, +0.23 inches above average
September 2024 Rainfall
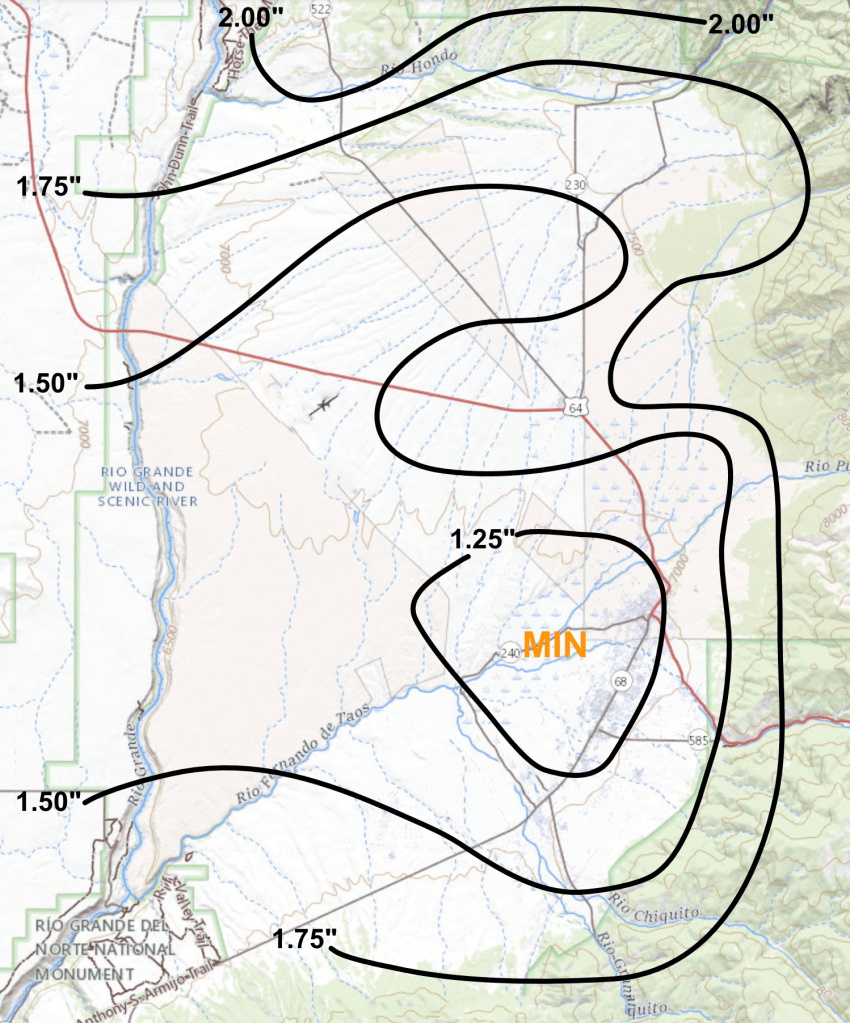
SEP 2024 at Taos 4 NNW
DATE HIGH LOW DAILY
DEP.MON.
DEP.RAIN REMARK 1 80 44 -1.9 -1.9 2 80 43 -2.6 -2.3 3 87 42 +0.9 -1.2 4 87 48 +4.1 +0.1 5 73 45 -4.0 -0.7 0.27″ 6 77 40 -4.3 -1.3 7 81 44 -0.2 -1.2 0.02″ 8 81 45 +0.4 -1.0 9 82 44 +1.1 -0.7 10 83 45 +2.4 -0.4 0.03″ 11 79 44 +0.2 -0.4 0.04″ 12 82 44 +2.4 -0.1 13 82 48 +4.9 +0.2 14 85 42 +3.9 +0.5 15 82 48 +5.5 +0.8 16 61* 49 -4.5 +0.5 0.62″* Record cold high & record daily rainfall 17 73 46 +0.2 +0.5 0.42″ 1/4″ hail & gust to 53 mph 110-115 PM 18 70 41 -3.6 +0.3 19 76 41 -0.5 +0.2 20 79 43 +2.8 +0.4 0.02″ 21 71 45 +0.2 +0.4 0.10″ 1/4″ hail 136-140 PM 22 66 41 -3.6 +0.2 23 71 44 +0.7 +0.2 24 76 39 +1.2 +0.2 25 80 41 +4.4 +0.4 26 83 44 +7.8 +0.7 27 85 45 +9.4 +1.0 Trace 28 77 54* +9.7 +1.3 0.01″ Record warm low 29 81 44 +7.0 +1.5 30 83 47 +9.5 +1.8 0.01″ AVGS/
TOTAL78.4 44.3 61.4 +1.8 1.54″ DAILY DEP. – Departure from the long term daily average temperature
MON. DEP. – Cumulative departure from the long term monthly average temperature
PCPN – Precipitation
—————————————————————————————————-
-
Weather Summary for August 2024
August 2024 overall was much warmer and a little wetter than average. The average temperature was 69.7 degrees, about 3.4 degrees above average, which was the fourth warmest on record for August. Rainfall for the month across the valley varied from a little below average along the Rio Grande Gorge, to above average along the foothills.
Areas along the foothills from around Arroyo Seco, then south into the Canon area and then west towards Talpa received the most rain at about 2.50 to 3.00 inches. Much of the central part of the valley from Ranchos north into Taos and the US 64 / NM 522 / NM 150 intersection received a little above average amounts. At my northside location, rainfall totaled 2.12 inches, about a quarter of an inch above average. About the driest location was once again down near the golf course west of Ranchos where amounts of around 1.25 inches occurred (see map below).
The month started out dry with above average temperatures through the first week, with highs in the low 90s. Things cooled off some during the second week as some daily rains fell across the region, and highs dropped into the mid 70s to mid 80s. Another dry and hot spell occurred during the third week, as highs again topped out in the low 90s. Another batch of monsoon moisture brought more rain and cooler temperatures for the fourth week, with highs back down into the upper 70s to mid 80s. Spotty late day showers lingered around during the end of the month, while mainly clear nights allowed overnight lows to drop into the mid to upper 40s.
Highs during the month were about 3.1 degrees above average, with lows coming in at about 3.7 degrees above average, the fourth warmest for August. The warmest high for the month was 94 degrees on the 4th, a record for that date. Another daily record high was recorded on the 7th with 93 degrees. The month ended up with 12 days of highs above 90 degrees, tied for the third most on record for August.
The coldest high was 75 degrees on the 8th. The warmest low was 61 degrees on the 1st, which tied the record warmest low for that date, and the coldest low of the month was 46 degrees on the 31st.
Winds for the month were about average, with just a few days with strong gusts over 35 mph. The highest gust of 43 mph occurred on the 29th. There were also about 19 days during the month with thunder, which is a little above average.
Here are the actual numbers for the month at the 4 NNW Taos location…
Average Temp . . . . 69.7 degrees, +3.4 degrees above average (4th warmest)
Average High . . . . . 85.5 degrees, +3.1 degrees above average
Average Low . . . . . 53.9 degrees, +3.7 degrees above average (4th warmest)
Total rain. . . . . . . . . 2.12 inches, +0.25 inches above average
August 2024 Rainfall
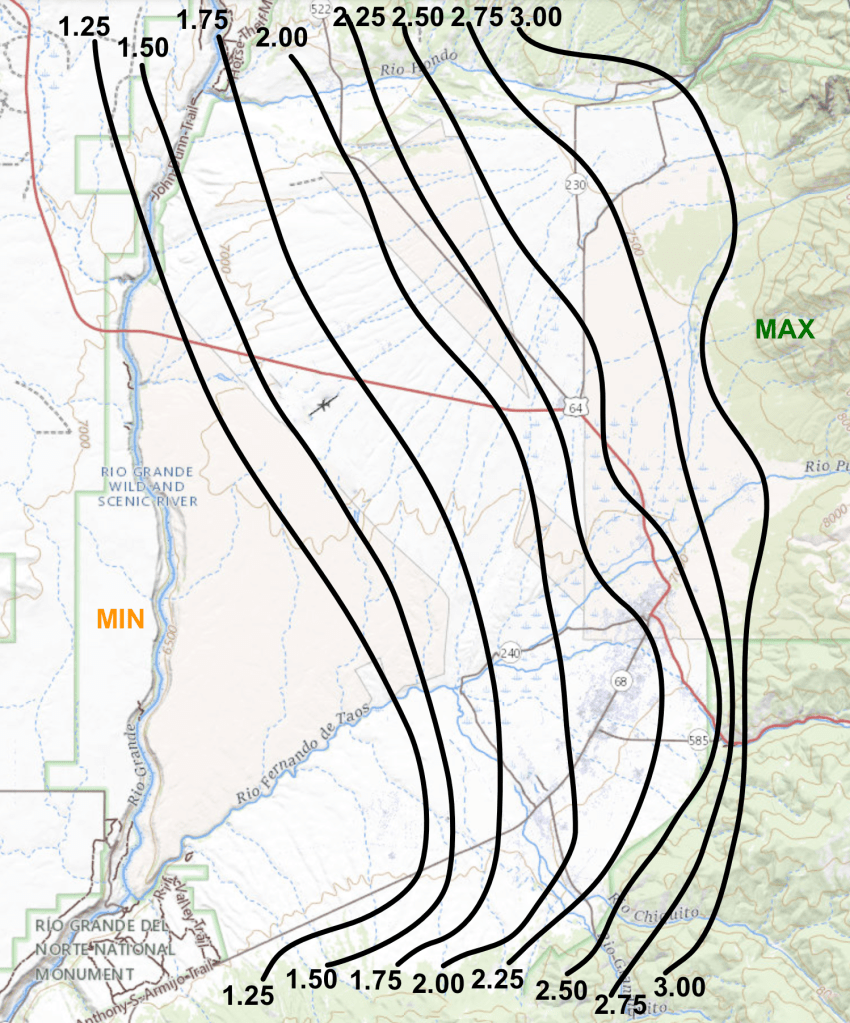
AUG 2024 DAILY DATA for 4 NNW Taos
DATE HIGH LOW DAILY
DEP.MON.
DEP.RAIN REMARK 1 82 61* +3.4 +3.4 0.05″ *Tied record warm low 2 91 57 +5.8 +4.6 Trace 3 90 54 +4.0 +4.4 4 94* 54 +6.3 +4.9 Trace *Record warm high 5 90 58 +6.5 +5.2 Trace 6 91 56 +6.0 +5.3 Trace 7 93* 52 +5.2 +5.3 Trace *Record warm high 8 75 59 -0.2 +4.6 0.03″ 9 76 58 -0.2 +4.1 0.01″ 10 78 57 +0.2 +3.7 0.19″ 11 81 56 +1.5 +3.5 0.17″ 12 88 55 +4.9 +3.6 0.29″ 13 82 55 +2.1 +3.5 0.19″ 14 84 52 +1.9 +3.4 0.04″ 15 87 50 +2.4 +3.3 16 91 54 +6.0 +3.5 17 92 52 +5.7 +3.6 18 90 53 +5.1 +3.7 19 92 53 +6.4 +3.8 20 92 55 +7.4 +4.0 0.23″ 21 91 57 +8.3 +4.2 0.02″ 22 87 52 +4.1 +4.2 23 85 51 +2.6 +4.1 Trace 24 86 55 +5.4 +4.2 0.59″ 25 77 52 -0.5 +4.0 0.15″ 26 77 55 +0.8 +3.9 0.08″ 27 81 49 0 +3.7 Trace 28 81 48 -0.5 +3.6 Trace 29 82 55 +3.9 +3.6 0.02″ 30 81 49 +0.6 +3.5 0.01″ 31 82 46 -0.4 +3.4 0.05″ AVGS/
TOTAL85.5 53.9 69.7 +3.4 2.12″ DAILY DEP. – Departure from the long term daily average temperature
MON. DEP. – Cumulative departure from the long term monthly average temperature
PCPN – Precipitation
—————————————————————————————————-
-
Weather Summary for July 2024
July 2024 was a little warmer but much drier than average. The average temperature was 69.9 degrees, about 1.9 degrees above average. Rainfall for the month across the valley was sparse, as much of the central and especially southern parts of the valley recorded totals of less than a half inch.
Northern sections received the most rain, only about 0.75″ to 1.25″ which was still quite a bit below average. The driest area was centered on the towns of Taos and Ranchos de Taos, where amounts were mainly less than a quarter of an inch, some 1.50″ below average.
The month started out with near average temperatures through the the first 12 days with highs in the 80s and lows in the upper 40s to mid 50s. Storms were most numerous on the 8th, where a heavy rain with small hail fell along the US 64 corridor near the OBL. It then warmed up for the middle of the month as highs climbed into upper 80s to low 90s. A brief cooldown occurred on the 21st and 22nd as highs stayed below 80 degrees with some storms around. Temperatures then warmed up to above average for the rest of the month, with highs in the upper 80s to low 90s.
Highs during the month averaged about 2.5 degrees above average, with lows just about 1.3 degrees above average. There were several days during the second and third weeks where lows dipped to the upper 40s to low 50s, which is a little below average. The warmest high for the month was 93 degrees on the 14th and 31st, while the coldest high was 78 degrees on the 8th. The warmest low was 59 degrees on the 15th, and the coldest low of 45 degrees occurred on the 7th.
One of the most notable features of the month weatherwise was the persistent cooling afternoon and evening winds which blew westward from the storms over the mountains to the east. Many times these easterly winds were quite strong in spots, like at my northside location, where there were 19 days with gusts over 35 mph, and 8 of those days had gusts over 40 mph. The day with the highest average wind speed was on the 8th, while the highest gust of 47 mph occurred on the 20th.
Here are the actual numbers for the month at the 4 NNW Taos location…
Average Temp . . . . 69.9 degrees, +1.9 degrees above average
Average High . . . . . 87.1 degrees, +2.5 degrees above average
Average Low . . . . . 52.6 degrees, +1.3 degrees above average
Total rain. . . . . . . . . 0.79 inches, -0.92 inches below average
July 2024 Rainfall

JUL 2024 DAILY DATA for 4 NNW Taos
DATE HIGH LOW DAILY
DEP.MON.
DEP.RAIN REMARK 1 80 60 +2.8 +2.8 0.04″ 2 85 56 +3.1 +2.9 Trace 3 88 52 +2.7 +2.9 4 91 51 +3.5 +3.0 5 87 52 +2.1 +2.8 6 86 52 +1.1 +2.6 7 88 45 -1.2 +2.0 8 78 53 -2.6 +1.4 0.58″ Pea size hail 150-157 PM 9 84 48 -1.6 +1.1 10 87 49 -0.5 +0.9 0.02″ 11 87 49 -1.0 +0.8 Trace 12 86 51 0.0 +0.7 Trace 13 92 51 +3.2 +0.9 Trace 14 93 57 +6.8 +1.3 Trace 15 91 59 +6.4 +1.7 Trace 16 92 55 +4.8 +1.9 Trace 17 86 55 +2.1 +1.9 0.11″ 18 85 50 -0.8 +1.7 19 89 53 +2.6 +1.8 Trace 20 86 54 +1.7 +1.8 0.01″ 21 79 56 -0.8 +1.6 Trace 22 79 48 -4.2 +1.4 23 85 47 -1.9 +1.2 24 90 51 +2.8 +1.3 0.02″ 25 89 51 +2.2 +1.3 26 88 57 +4.6 +1.5 0.01″ 27 88 49 +1.0 +1.4 Trace 28 90 56 +5.5 +1.6 Trace 29 89 53 +2.8 +1.6 Trace 30 90 57 +5.3 +1.7 31 93 54 +5.5 +1.9 AVGS/
TOTAL87.1 52.6 69.9 +1.9 0.79″ DAILY DEP. – Departure from the long term daily average temperature
MON. DEP. – Cumulative departure from the long term monthly average temperature
PCPN – Precipitation
—————————————————————————————————-

Taos Weather

