-
Weather Summary for June 2024
June 2024 was warmer and wetter than average. The average temperature was 68.4 degrees, about 4.6 degrees above average, making it the 4th warmest June on record (since 1900). Rainfall across the valley was somewhat variable – the total at my northside location (a drier spot for the month) was 1.60″, which was still 0.72 inches above average.
Rainfall varied quite a bit for the month (see map below). Overall rainfall was mainly between 1.50 and 2.00 inches for the month. A minimum of rain fell near the airport where amounts were less than 1.50 inches. Higher amounts of 2.00 to 2.50 inches were recorded in a southwest to northeast oriented band across the town of Taos, where a downpour occurred on the 20th, dropping about 1.25 inches of rain in an hour.
The month started out dry and quite warm, with highs in the mid 80s to low 90s, with a record high of 94 degrees on the 6th. Some cooler readings and showers occurred from the 9th to 11th, with a high of only 64 degrees on the 10th, tying a record cool high for that date. Mainly dry and warm readings then prevailed through the 18th. A very moist airmass invaded the region starting on the 19th, leading up to the downpour on the 20th. Hot temps then returned for the 23rd to the 26th with readings in the low 90s. Another period of rain then occurred from the 27th to the end of the month, with near average temperatures.
Much of the above average warmth during the month was because of the warm overnight low temperatures. The average low for the month was 51.5 degrees, which was 5.6 degrees above average, making June 2024 the warmest month for average lows. Numerous record warm low temperature records were tied or broken, see the daily listing below for the dates.
The warmest high for the month was 94 degrees on the 6th, while the coldest high was 64 degrees on the 10th. The warmest low was 62 degrees on the 26th, and the coldest low of 41 degrees occurred on the 3rd.
Wind speeds overall were about average for the month. There were a total of 10 days with gusts of 35 mph or higher, mainly due to nearby thunderstorms. The day with the highest average wind speed was on the 19th as strong moist easterly winds blew into the valley, while the highest gust of 48 mph occurred on the 6th.
Here are the actual numbers for the month…
Average Temp . . . . 68.4 degrees, +4.6 degrees above average
Average High . . . . . 85.2 degrees, +3.6 degrees above average
Average Low . . . . . 51.5 degrees, +5.6 degrees above average
Total precip . . . . . . 1.60 inches, +0.72 inches above average
June 2024 Rainfall

JUN 2024 DAILY DATA for 4 NNW Taos
DATE HIGH LOW DAILY
DEP.MON.
DEP.RAIN REMARK 1 82 46 +5.2 +5.2 2 83 47 +5.6 +5.4 3 84 41 +2.7 +4.5 4 84 52* +8.1 +5.4 Tied record warm low 5 91* 48 +9.0 +6.1 Tied record warm high 6 94* 48 +9.5 +6.7 Record warm high 7 90 60* +13.7 +7.7 Record warm low 8 91* 51 +9.5 +7.9 Tied record warm high 9 85 48 +4.8 +7.6 0.11″ 10 64* 53 -3.5 +6.5 0.13″ Tied record cold high 11 81 44 0.0 +5.9 Trace 12 90 49 +6.7 +5.9 Trace 13 93 49 +8.0 +6.1 14 77 49 -0.6 +5.6 0.17″ 15 85 42 -0.3 +5.2 16 91 48 +5.5 +5.2 17 87 53 +5.5 +5.3 18 85 51 +3.2 +5.1 19 82 57* +4.5 +5.1 0.04″ Record warm low 20 79 55 +1.5 +4.9 0.16″ Brief pea hail 133 PM 21 80 57 +2.6 +4.8 0.08″ 22 82 57 +3.8 +4.8 0.01″ 23 84 55 +3.5 +4.7 24 91 54 +5.7 +4.7 25 93 56 +8.1 +4.9 26 93 62* +10.8 +5.1 0.07″ Record warm low 27 78 54 -1.0 +4.9 0.48″ 28 86 50 +0.3 +4.7 29 87 53 +2.5 +4.6 30 83 57* +2.8 +4.6 0.35″ Tied record warm low AVGS/
TOTALAvg 85.2 Avg 51.5 Monthly Avg 68.4 Monthly Dep +4.6 Total 1.60″ DAILY DEP. – Departure from the long term daily average temperature
MON. DEP. – Cumulative departure from the long term monthly average temperature
—————————————————————————————————-
-
Weather Summary for May 2024
May 2024 was overall rather windy with just a tad above average temperatures and a little above average rainfall. The average temperature was 54.9 degrees, about 0.5 degrees above average, while the precipitation total at my northside location was 1.35″, which was about 0.20″ above average.
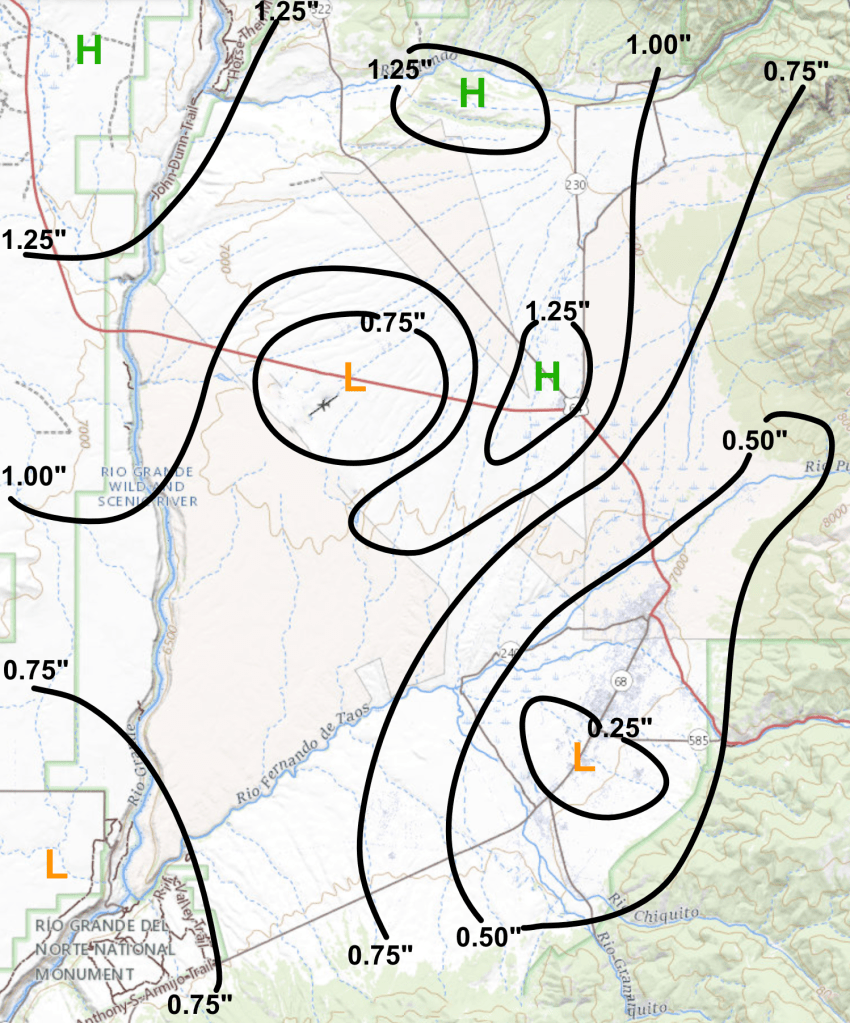
Precipitation across the valley varied quite a bit for the month (see map below). Overall rainfall was mainly between 0.50 and 0.85 inches for the month. A minimum of rain fell just north and east of the Ranchos area, where amounts were around 0.25″ or less. Higher amounts of 0.85 to 1.30 inches were recorded in a southwest to northeast oriented band across the center of the valley into the northern sections. Most of this heavier rain fell in numerous showers across this area on May 11th, with a daily record amount of rain falling (0.80″) at my northside location.
The month started out dry with near average temperatures as lows were in the 30s and highs in the 60s to low 70s. Nearly all of the rain during the month fell from the 9th to the 16th, when it was also a little cooler than usual. Mainly dry and warmer readings then prevailed during the last 2 weeks of the month, with highs in the 70s to low 80s and lows in the mid 30s and 40s.
The warmest high for the month was 81 degrees on the 28th and 30th, while the coldest high was 55 degrees on the 12th. The warmest low was 50 degrees on the 29th, and the coldest low of 31 degrees occurred on the 7th and 8th.
Wind speeds overall were above average for the month, as persistent mainly afternoon winds blew about every day. There were a total of 17 days with gusts of 35 mph or higher. Several days had moderate to strong winds, mainly on the 6th through the 10th, and on the 23rd and 25th. The day with the highest average wind speed was on the 6th, while the highest gust of 49 mph occurred on the 7th.
Here are the actual numbers for the month…
Average Temp . . . . 54.9 degrees, +0.5 degrees above average
Average High . . . . . 70.9 degrees, -0.1 degrees below average
Average Low . . . . . 38.8 degrees, +1.1 degrees above average
Total precip . . . . . . 1.35 inches, +0.20 inches above average
Total snowfall . . . . None, -1.0 inches below average
May 2024 Rainfall
MAY 2024 DAILY DATA for 4 NNW Taos
DATE HIGH LOW DAILY
DEP.MON.
DEP.PCPN SNOW REMARK 1 74 34 +4.6 +4.6 2 68 35 +2.1 +3.4 3 72 35 +3.5 +3.4 4 68 40 +2.7 +3.2 5 72 39 +3.5 +3.3 6 62 37 -2.3 +2.3 7 69 31 -2.1 +1.7 8 62 31 -5.7 +0.8 9 60 36 -4.4 +0.2 0.12″ 10 59 40 -3.0 -0.1 0.01″ 11 60 39 -3.0 -0.4 0.80″ Small hail & record rainfall 12 55 33 -8.8 -1.1 0.03″ 13 71 32 -2.0 -1.1 0.01″ 14 72 38 +0.9 -1.0 0.01″ 15 68 39 -1.1 -1.0 T 16 61 42 -3.1 -1.1 0.35″ 17 76 37 +1.7 -1.0 18 80 41 +4.9 -0.6 19 76 48 +6.4 -0.3 0.01″ 20 76 41 +3.0 -0.1 0.01″ 21 70 39 -1.6 -0.2 22 73 32 -3.5 -0.3 23 74 39 +0.4 -0.3 24 75 40 +1.3 -0.2 25 73 46 +2.8 -0.1 26 74 40 -0.3 -0.1 27 77 36 -1.1 -0.2 28 81 44 +4.6 0.0 29 80 50 +6.9 +0.2 30 81 45 +4.5 +0.4 31 80 45 +3.9 +0.5 AVGS/
TOTAL70.9 38.8 54.9 +0.5 1.35″ DAILY DEP. – Departure from the long term daily average temperature
MON. DEP. – Cumulative departure from the long term monthly average temperature
PCPN – Precipitation
—————————————————————————————————-
-
Weather Summary for April 2024
April 2024 was overall a bit above average for temperatures and near average for precipitation. The average temperature was 47.9 degrees, about 2 degrees above average, while the precipitation total at my northside location was 0.86″, which was about 0.07″ below average.
Precipitation across the valley was mainly between 0.50 and 0.85 inches for the month of April. Slightly higher amounts of 0.85 to 1.10 inches were recorded along the foothills from Arroyo Seco south to the Canon area.
The month started out cool and wet with some rain and snow on the 1st, 2nd and 6th, with a record daily amount of snow occurring on the 6th (2.5″). Then It gradually became warmer and drier through the bulk of the month until about the 26th. Highs during this time were in the 60s to mid 70s, with lows in the 20s to mid 30s. A weak system brought some moisture and cooler temperatures for the 26th to 28th, but then it warmed back up again by the end of month.
The warmest high for the month was 77 degrees on the 23rd, which tied the record high reading for that date. The coldest high was 42 degrees on the 1st. The warmest low was 43 degrees on the 24th, with the coldest low of 19 degrees occurring on the 7th.
Wind speeds overall were about average for the month. There were a total of 10 days with gusts of 35 mph or higher. The day with the highest average wind speed was on the 6th, while the highest gust of 54 mph occurred on the 19th.
Here are the actual numbers for the month…
Average Temp . . . . 47.9 degrees, +2.0 degrees above average
Average High . . . . . 64.4 degrees, +2.6 degrees above average
Average Low . . . . . 31.5 degrees, +1.5 degrees above average
Total precip . . . . . . 0.86 inches, -0.07 inches below average
Total snowfall . . . . 6.6 inches, +3.3 inches above average
APR 2024 DAILY DATA for 4 NNW Taos
DATE HIGH LOW DAILY
DEP.MON.
DEP.PCPN SNOW REMARK 1 42 31 -5.6 -5.6 0.20″ 3.4″ 2 55 30 +0.3 +2.6 0.01″ 0.2″ 3 64 24 +1.5 +1.2 4 68 31 +7.5 +1.0 5 67 39 +10.1 +2.8 6 50 23 -7.3 +1.1 0.27″ 2.5″ Record snow 7 52 19 -8.0 -0.2 8 53 24 -5.3 -0.8 9 57 27 -2.3 -1.0 10 62 21 -2.7 -1.2 11 66 27 +2.0 -0.9 12 72 30 +6.0 -0.3 13 70 37 +8.0 +0.3 14 72 29 +4.8 +0.6 15 61 34 +1.4 +0.7 16 67 28 +0.9 +0.7 17 71 29 +3.0 +0.8 18 73 34 +6.1 +1.1 19 72 39 +9.0 +1.6 20 67 39 +6.1 +1.8 0.01″ 21 67 29 +0.4 +1.7 22 75 35 +6.5 +1.9 23 77 37 +8.9 +2.2 Tied record high 24 74 43 +10.1 +2.6 25 70 37 +5.1 +2.7 Trace 26 63 35 +0.9 +2.6 0.03″ 27 47 33 -8.4 +2.2 0.33″ 0.5″ 28 59 33 -3.0 +2.0 0.01″ Trace 29 66 29 -2.0 +1.9 30 74 38 +7.0 +2.0 AVGS/
TOTALMax
64.4Min
31.5Month
47.9+2.0 0.86″ 6.6″ DAILY DEP. – Departure from the long term daily average temperature
MON. DEP. – Cumulative departure from the long term monthly average temperature
PCPN – Precipitation
—————————————————————————————————-

Taos Weather

